As organizations continue exploring AI, we’re seeing a common challenge emerge. The question is rarely which AI tool to choose. More often, it’s whether the organization’s data is ready to support it.
Most businesses and municipalities don’t have a shortage of data. They have plenty of it. The challenge is that valuable information is often spread across Dynamics 365, ERP and HR platforms, Microsoft 365, SharePoint, SQL databases, operational systems, third-party applications, and spreadsheets.
That becomes a problem when someone needs an answer that crosses more than one of those systems.
Finance may have one version of the numbers. Operations may have another. A Power BI report may provide part of the answer, while someone still needs to pull information from a spreadsheet or another application to complete the picture.
This is where the underlying data strategy starts to matter.
That’s Where Microsoft Fabric Comes In
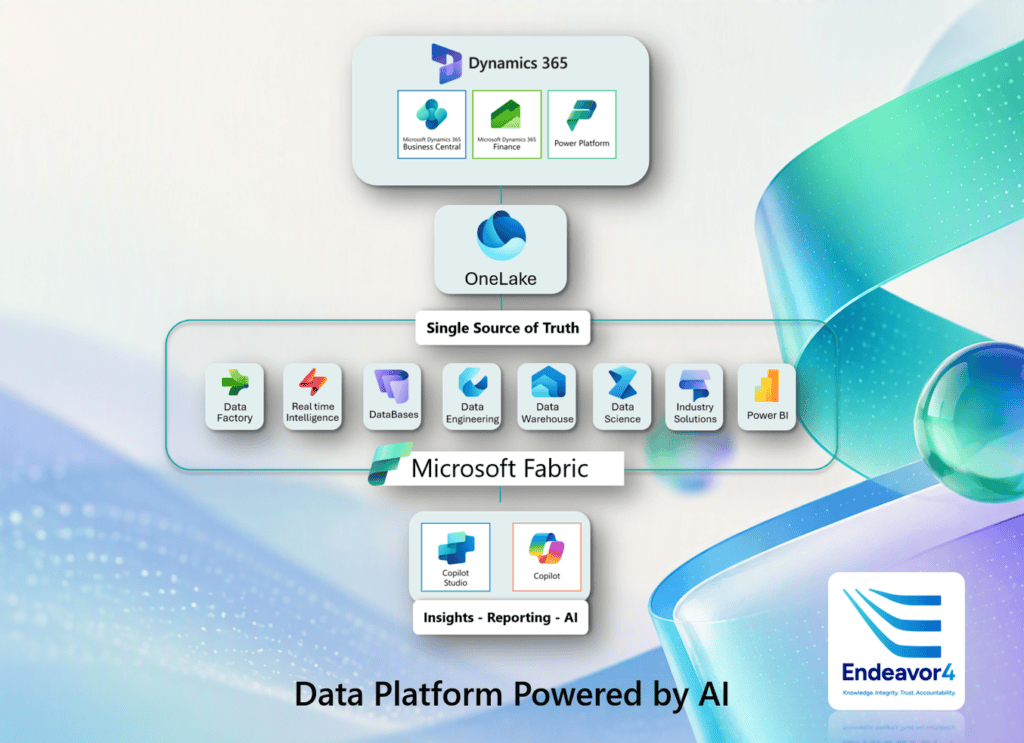
Microsoft Fabric brings several of Microsoft’s data and analytics capabilities into one environment, including data integration, data engineering, data warehousing, real-time analytics, Power BI, and AI.
At the center is OneLake, Microsoft’s unified data foundation. It gives organizations a way to bring information from different sources together so reporting and analytics don’t have to depend on separate copies of the same data.
For companies already making significant investments in Microsoft technology, that’s important. Fabric provides a way to make better use of data coming from Dynamics 365, Business Central, Power Platform, Microsoft 365, SQL, SharePoint, and other business applications.
The goal isn’t simply to put more data in one place. It’s to make that information easier to use together.
A Practical Example
Consider a municipality using Dynamics 365 for service management, AMANDA for permitting, ADP for HR, and Power BI for reporting.
Leadership asks what sounds like a straightforward question:
Are increases in service requests impacting response times, and do staffing levels correlate with the departments experiencing the highest demand?
Everything needed to answer that question probably exists.
The challenge is that it doesn’t necessarily exist in the same place.
One system has the service requests. Another has employee and staffing information. Other operational data may sit somewhere else. Someone then has to bring those pieces together before leadership can see the full picture.
Fabric gives organizations a way to bring those datasets into a common analytical environment, making it easier to look at what’s happening across departments rather than one application at a time.
The same thinking can be applied to municipal finance, permitting, utilities, billing, service requests, work orders, and customer service information.
Without that broader view, we tend to hear familiar questions:
- Why don’t these reports match?
- Which number should we trust?
- Why does executive reporting take so much effort?
- Why are we still combining information manually?
Those aren’t necessarily Power BI problems. Often, they’re signs that the data underneath the reports is still fragmented.
More Than Power BI
One misconception we encounter is that Fabric replaces Power BI. It doesn’t.
Power BI remains an important part of Microsoft’s reporting and visualization experience. Fabric helps with what happens behind those reports, including how information is brought together, prepared, stored, and made available for analysis.
A simple way to look at it is this:
Power BI helps you see the information. Fabric helps bring the information together.
That’s particularly relevant for businesses that already have a significant Power BI investment. Moving toward Fabric doesn’t mean throwing away what they’ve built. It can provide a stronger data foundation behind those reports and dashboards.
It also gives executives an opportunity to work from a more consistent view of KPIs, financial information, operational trends, and other measures without teams spending as much effort reconciling information from different applications.
Looking Beyond Individual Systems
The opportunity isn’t limited to CRM and service data.
Take Business Central as an example. Finance, purchasing, projects, inventory, and other operational information can tell you a great deal about the organization, but the picture becomes much more useful when that information can be considered alongside customer, sales, HR, or operational data.
Now you’re not simply asking:
“What happened in our ERP?”
You can start asking questions such as:
“What is influencing our financial performance?“
“Is increased customer demand affecting staffing or operational costs?”
“How closely does our sales pipeline align with actual revenue?”
“Where are we seeing changes in operational demand?”
These are the kinds of questions that are difficult to answer when every application is effectively its own information island.
Why Fabric Matters for AI
This becomes even more important when AI enters the conversation.
AI doesn’t automatically fix underlying data problems.
There’s understandable excitement around Microsoft Copilot, AI agents, predictive analytics, and the ability to interact with information using natural language. But if the underlying information is inconsistent or scattered across applications, AI has the same fundamental problem people do: it needs access to useful, reliable information.
That’s why we tend to look at AI readiness as a data conversation first.
Before asking what an AI agent could do, it’s worth asking some more basic questions:
- Where does the information it needs live?
- Can that information be brought together?
- Do we trust it?
- Who should have access to it?
- Are we solving a real business problem with it?
Fabric can play an important role in establishing that foundation.
Go back to our municipal example. If information from Dynamics 365, ADP, AMANDA, finance, and other operational systems can be brought together, leadership has a much better starting point for understanding service demand, staffing pressures, financial impacts, and operational performance.
The immediate benefit may be better reporting.
The longer-term opportunity is having better data available for AI.
From Reports to Better Questions
There’s another change that happens when the data foundation improves.
People can spend less time debating where the numbers came from and more time discussing what the numbers mean.
Executive reporting shouldn’t require several departments to export spreadsheets, combine information, reconcile differences, and then explain why two reports don’t quite agree.
With Power BI sitting on top of a stronger data foundation, dashboards can provide a clearer view across the business.
The conversation can move from:
“Which report has the right number?”
to:
“What is happening, why is it happening, and what should we do next?”
That’s ultimately where the value lies.
Build the Foundation First
If your organization already uses Dynamics 365, Business Central, Power Platform, Power BI, Microsoft 365, or other Microsoft technologies, you may already have many of the pieces you need.
The first step doesn’t have to be a major data transformation.
Start by looking at where your important information lives today. Identify where teams are manually combining data, where reports regularly disagree, or where leadership struggles to get answers that cross multiple business systems.
Those are often good indicators of where Fabric could provide value.
From there, the question becomes much more practical: which data should we bring together first, and what business problem are we trying to solve?
How Endeavor4 Can Help
At Endeavor4, we typically start by understanding where your data lives today, where reporting gaps exist, and what you’re ultimately trying to accomplish.
From there, we can look at where Microsoft Fabric makes sense, which systems should be connected, and what a realistic path forward looks like.
Our experience across Dynamics 365 CRM, Business Central, Power Platform, Power BI, Microsoft Copilot, municipal platforms, and customer service solutions means we’re often working with the systems that hold this information in the first place. The current Microsoft Fabric – Data Analytics – Canada and US – Endeavor4 CRM page similarly positions Endeavor4’s Fabric practice around its broader Microsoft platform experience.
For us, the conversation isn’t simply about implementing another Microsoft technology.
It’s about making better use of the data you already have and putting the right foundation in place for what comes next. Learn More about Microsoft Fabric consulting here: https://www.endeavor4crm.com/microsoft-fabric/